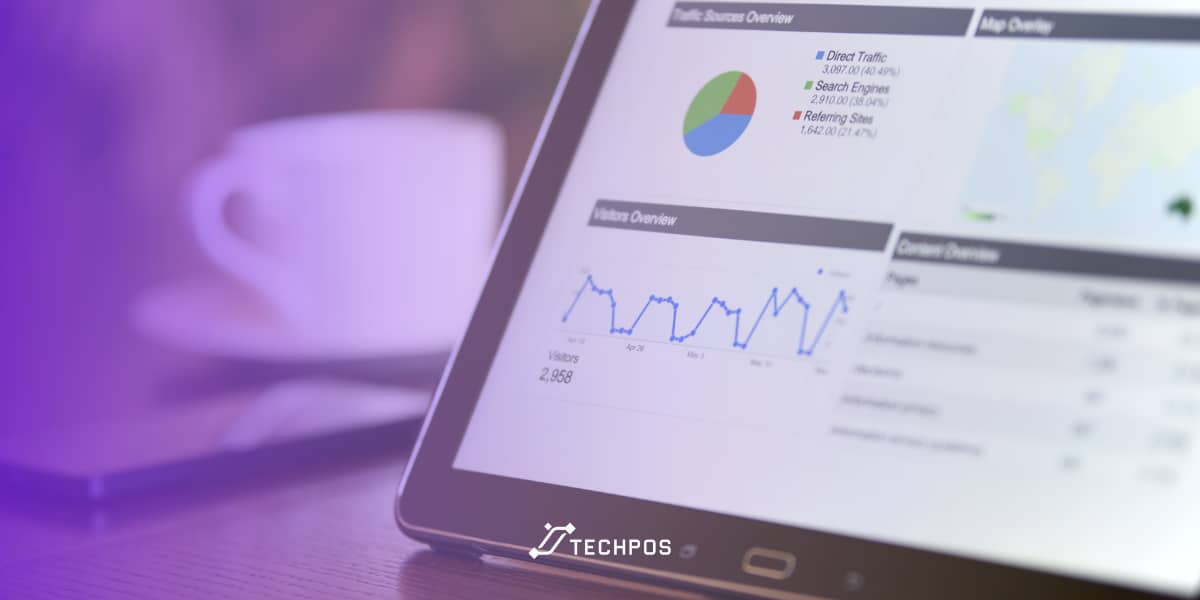
We’re sure you are already pulling critical sales reports for your cannabis business. But it’s not just daily sales that you need to keep an eye on. The more detailed information you can pull about inventory, staffing, transactions, and customers, the smarter your long-term decision-making becomes.
As an owner or manager, the numbers pulled from your daily business reports offer a pulse check on the business’s health in terms of sales, customer counts, and staff performance. You can use this intel for better marketing, staffing, and inventory planning.
Use Key Performance Indicators to Guide Your Business Development
For starters, you need to develop a set of KPIs, also called Key Performance Indicators. These are quantifiable methods to measure your business’s success and growth trajectory. While they can technically cover just about any area of your business, typically KPIs measure finances, customers, and operations.
What KPIs you choose to adopt in your own cannabis store is up to you. But, they should be in line with your ultimate goals as a business. Is it to retain customers? Is it to expand? Name the goal, then build strong KPIs to support that goal.
A few common KPIs you may want to work with as a cannabis retailer are as follows:
- Transaction time
- Traffic flow
- Employee performance
- Average transaction numbers
- Inventory
Start with the Basics: Sales, Costs, Inventory
TechPOS makes it easy to monitor the fundamentals of business: sales, costs, and inventory. With the click of a button from the Business Insights Dashboard, you can access real-time analytics covering business reporting from all perspectives.
Use the basic reports to ask important questions like how much you are selling per customer, how much money is tied up in inventory, and the visible customer trends.
For example, you may think your inventory report serves only to inform the next order, but your inventory sheet can paint a much bigger picture.
For starters, it can tell you which brands, categories, and specific products are in hot demand and which are wasting shelf space. This can inform the layout of your store, the brands you choose to carry, and how you structure upcoming sales.
Go a Bit Deeper: Average Basket Size and Totals
Many consumer-facing businesses track two key metrics: the average basket size and the average basket total. For example, if you log in to the TechPOS dashboard, you might find that your customers are buying 2.3 products and spending $32 per transaction.
This gives you a good benchmark for what customers are comfortable spending and perhaps gives insight into how to push that needle higher with bigger ticket items in their favourite categories or selling products per basket with counter-level sales.
Why not charge your budtenders with up-selling at the counter? Up-selling, or cross-selling, is the tactic of suggestive sales, offering a discounted or small item for sale at the time of purchase. It’s the equivalent of asking, “Would you like fries with that?”
These small items add up even if you are selling a branded lighter or a discontinued preroll flavour. When you pull the reports at the end of the day, these little add-ons will increase the number of items per sale, and the total profits from that sale.
Customer Demographics and Shopping Trends
Going one step further into your business reporting journey is to explore your customer demographics. Start by asking questions: Who is shopping at your store? When are they shopping? What are they buying?
The TechPOS total solution helps collect some of this information but also integrates with cannabis industry leader Headset for deeper consumer insights. Headset provides retailers with cannabis data and market intelligence, focusing on purchasing behaviour and retail trends at your store level and beyond.
Data like this can help you plan for big holidays, like 420 and New Year’s Eve. It can also help you better manage your inventory.
If you look at your sales sheets and see that vape cartridges are one of the top sellers among your customers, it’s time to pivot the store’s layout and focus on ordering inventory in that category.
Customer demographics can also help you advertise better. Especially if you use email marketing, you can curate each campaign to specific demographics.
You should be able to divide your customer database into several different segments. Look for segments based on their purchasing history and online account. As only one example of how you can use this information to your advantage: market premium products to the big spenders and big discounts to those who only shop for sales.
Don’t Ignore the Numbers — Business Reporting is Your Greatest Asset
Business reporting isn’t just something to hand over to your accountants. As a manager and/or owner, you need to make them part of your daily routine. The more you know about the success and failures within your store, the better you can adapt, strategize, and succeed.
From sales reporting to inventory to employee management, use TechPOS’s dashboard as an easy and accessible overview of your store’s health index.
Then, make your business strategy even stronger with TechPOS’ series of data-driven integrations from the likes of Headset and beyond. Observe business trends, sales performance, and staffing numbers to empower your decision-making on every single level.


